FAQ: How to convert values to text in Excel using the TEXT function.
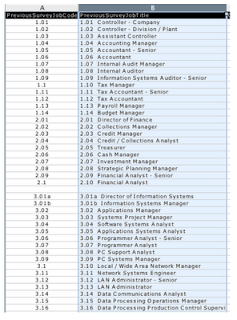
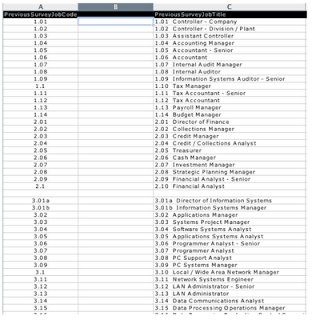
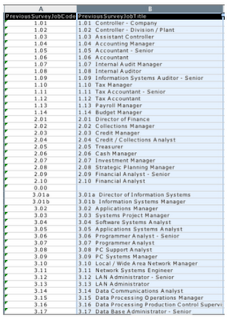
Here's a tip for Excel to allow you to load organizational or survey job codes that are a mix of number codes and letter codes. For example, some surveys have job numbers similar to the following:
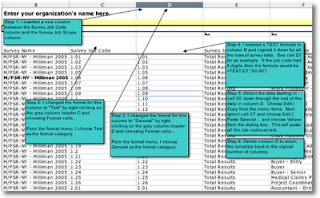
NextComp will read only the numeric OR text depending on how the data is sorted in the import template. You’ll need to convert all of the job codes to text data in Excel. The image below gives a quick visual summary of the process. Click the image for a larger version.
Here's a step-by-step description for Excel 2003 and prior versions. The same techniques work in Excel 2007, although the menu names may be slightly different.
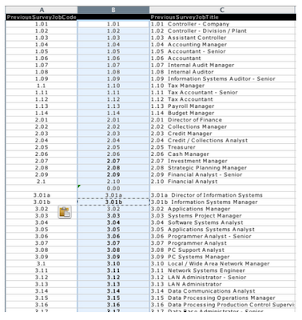
Step 1: Select all of column B by clicking in column B’s header
 Step 2: Select the Insert menu in Excel, then select Columns
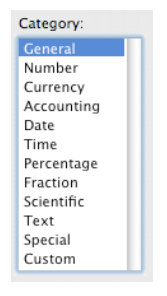
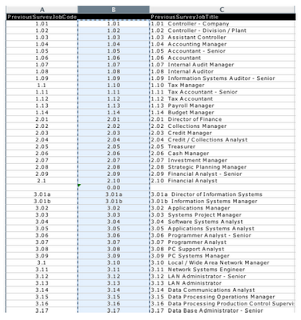
 Step 3: Select the Format menu item in Excel and then select the Cells menu item
 Step 6: Select cell B2
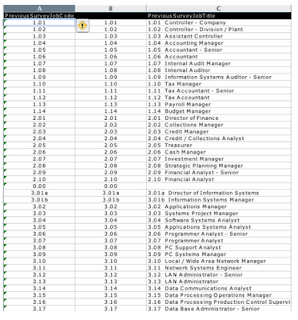
Step 7: Enter the formula shown below into cell B2. Here's a description of the TEXT function on the Microsoft Office website.
 Step 8: Copy cell B2 down all the way to the last row of job code data
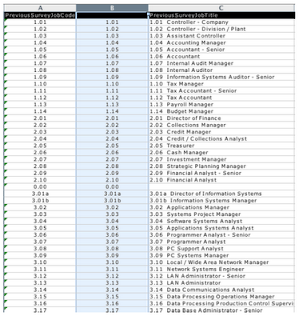
 Step 9: Select data in column B from cell B2 through to the last row of data in the column
 Step 10: Select the Edit menu item in Excel and then select the Copy menu item
Step 11: Select cell A2
Step 12: Select the Edit menu item in Excel and then select the Paste Special... menu item
Step 13: Choose “Values” as the Paste type
Step 14: Click the OK button
 Step 15: Select all of column B by clicking on the column header for B
 Step 16: Select the Edit menu in Excel and then select the Delete menu item
 Step 17: Select the File menu item in Excel
Step 18: Select the Save item in the File menu
- 1000
- 1000R
- 10.10
- 10.11
- 10.12
- 10.1
- 10.11
- 10.12
NextComp will read only the numeric OR text depending on how the data is sorted in the import template. You’ll need to convert all of the job codes to text data in Excel. The image below gives a quick visual summary of the process. Click the image for a larger version.

Here's a step-by-step description for Excel 2003 and prior versions. The same techniques work in Excel 2007, although the menu names may be slightly different.
Step 1: Select all of column B by clicking in column B’s header
 Step 2: Select the Insert menu in Excel, then select Columns
 Step 3: Select the Format menu item in Excel and then select the Cells menu item
 Step 6: Select cell B2
Step 7: Enter the formula shown below into cell B2. Here's a description of the TEXT function on the Microsoft Office website.
 Step 8: Copy cell B2 down all the way to the last row of job code data
 Step 9: Select data in column B from cell B2 through to the last row of data in the column
 Step 10: Select the Edit menu item in Excel and then select the Copy menu item
Step 11: Select cell A2
Step 12: Select the Edit menu item in Excel and then select the Paste Special... menu item
Step 13: Choose “Values” as the Paste type
Step 14: Click the OK button
 Step 15: Select all of column B by clicking on the column header for B
 Step 16: Select the Edit menu in Excel and then select the Delete menu item
 Step 17: Select the File menu item in Excel
Step 18: Select the Save item in the File menu
Labels: convert, data loading, excel, excel tip, function, mixed data types, nextcomp, survey data, text, tip, values, values to text
posted by Matt Johnson at
1:20 PM
|
0 comments
![]()
![]()


